ot2 days ago
Utilization is not a lie, it is a measurement of a well-defined quantity, but people make assumptions to extrapolate capacity models from it, and that is where reality diverges from expectations.
Hyperthreading (SMT) and Turbo (clock scaling) are only a part of the variables causing non-linearity, there are a number of other resources that are shared across cores and "run out" as load increases, like memory bandwidth, interconnect capacity, processor caches. Some bottlenecks might come even from the software, like spinlocks, which have non-linear impact on utilization.
Furthermore, most CPU utilization metrics average over very long windows, from several seconds to a minute, but what really matters for the performance of a latency-sensitive server happens in the time-scale of tens to hundreds of milliseconds, and a multi-second average will not distinguish a bursty behavior from a smooth one. The latter has likely much more capacity to scale up.
Unfortunately, the suggested approach is not that accurate either, because it hinges on two inherently unstable concepts
> Benchmark how much work your server can do before having errors or unacceptable latency.
The measurement of this is extremely noisy, as you want to detect the point where the server starts becoming unstable. Even if you look at a very simple queueing theory model, the derivatives close to saturation explode, so any nondeterministic noise is extremely amplified.
> Report how much work your server is currently doing.
There is rarely a stable definition of "work". Is it RPS? Request cost can vary even throughout the day. Is it instructions? Same, the typical IPC can vary.
Ultimately, the confidence intervals you get from the load testing approach might be as large as what you can get from building an empirical model from utilization measurement, as long as you measure your utilization correctly.
eklitzke2 days ago
I agree. If you actually know what you're doing you can use perf and/or ftrace to get highly detailed processor metrics over short periods of time, and you can see the effects of things like CPU stalls from cache misses, CPU stalls from memory accesses, scheduler effects, and many other things. But most of these metrics are not very actionable anyway (the vast majority of people are not going to know what to do with their IPC or cache hit or branch hit numbers).
What most people care about is some combination of latency and utilization. As a very rough rule of thumb, for many workloads you can get up to about 80% CPU utilization before you start seeing serious impacts on workload latency. Beyond that you can increase utilization but you start seeing your workload latency suffer from all of the effects you mentioned.
To know how much latency is impacted by utilization you need to measure your specific workload. Also, how much you care about latency depends on what you're doing. In many cases people care much more about throughput than latency, so if that's the top metric then optimize for that. If you care about application latency as well as throughput then you need to measure both of those and decide what tradeoffs are acceptable.
tracker1a day ago
> There is rarely a stable definition of "work". Is it RPS? Request cost can vary even throughout the day. Is it instructions? Same, the typical IPC can vary.
I think this is probably one of the most important points... similarly, is this public facing work dealing with any kind of user request, or is it simply crunching numbers/data to build an AI model from a stable backlog/queue?
My take has always been with modern multi-core, hyper-threaded CPUs that are burstable is to consider ~60% a "loaded" server. That should have work split if it's that way for any significant portion of a day. Mostly dealing with user-facing services. So bursts and higher traffic portions of the day are dramatically different from lower utilization portions of the day.
A decade ago, this lead to a lot of work for cloud provisioning on demand for the heavier load times. Today it's a bit more complicated when you have servers with 100+ cores as an option for under $30k (guestimate based on $10k CPU price). Today, I'd lean to over-provisioning dedicated server hardware and supplement with cloud services (and/or self-cloud-like on K8s) as pragmatically as reasonable... depending on the services of course. I'm not currently in a position where I have this level of input though.
Just looking at how, as an example, StackOverflow scaled in the early days is even more possible/prudent today to a much larger extent... You can go a very long way with a half/full rack and a 10gb uplink in a colo data center or two.
In any case, for me... >= 65% CPU load for >= 30m/day means it's at 100% effective utilization, and needs expansion relatively soon. Just my own take.
everforwarda day ago
> In any case, for me... >= 65% CPU load for >= 30m/day means it's at 100% effective utilization, and needs expansion relatively soon.
I think this depends on workload still because IO heavy apps hyperthread well and can push up to 100%. I think most of the apps I've worked on end up being IO bound because "waiting on SQL results" or the more generic "waiting on downstream results" is 90% of their runtime. They might spend more time reading those responses off the wire than they do actually processing anything.
There are definitely things that isn't true of though, and your metrics read about right to me.
jimmySixDOF2 days ago
IEEE Hot Interconnects just wrapped up and they discussed latency performance tuning for Ultra Ethernet where it looks smooth on 2- or 5- sec view but at 100ms you see the obvious frame burst effects. If you don't match your profiling to the workload a false negative compounds your original problem by thinking you tested this so better look elsewhere.
SAI_Peregrinusa day ago
That's all true, and the % part is still a lie. As you note, CPU utilization isn't linear, and percentages are linear measures. CPU utilization isn't a lie, % CPU utilization is.
ota day ago
It is a linear percentage of the amount of time the CPU is not idle. It is not linear in the amount of useful work, but that's not what "utilization" means.
The lie is the assumption that CPU time is linear in useful work, but that has nothing to do with the definition of utilization, it's just something that people sometimes naively believe.
> CPU utilization isn't a lie, % CPU utilization is
What do you mean by this? Utilization is, by definition, a ratio. % just determines that the scale is in [0, 100].
SAI_Peregrinusa day ago
Utilization can never reach 100%, since not all of the components of the CPU (or even one core) can actually be in use at once. Quite a few are shared between operations and thus mutually exclusive.
17186274406 hours ago
It's of course time. It's 1-X all components of the CPU were idle.
SirMaster2 days ago
What about 2 workloads that both register 100% CPU usage, but one workload draws significantly more power and heats the CPU up way more? Seems like that workload is utilizing more of the CPU, more of the transistors or something.
inetknght2 days ago
Indeed, and there's a thing called "race to sleep". That is, you want to light up as much of the core as possible as fast as possible so you can get the CPU back to idle as soon as possible to save on battery power, because having the CPU active for more time (but not using as many circuits as it "could") draws a lot more power.
MBCook2 days ago
At the same time, it takes a certain amount of time for a CPU to switch power levels, and I remember it being surprisingly slow on some (older?) processors.
So in Linux (and I assume elsewhere) there were attempts to figure out if the cost in time/power to move up to a higher power state would be worth the faster processing, or if staying lower power but slower would end up using less power because it was a short task.
I think the last chips I remember seeing numbers for were some of the older Apple M-series chips, and they were lightning fast to switch power levels. That would certainly make it easier to figure out if it was worth going up to a higher power state, if I’m remembering correctly.
magicalhippoa day ago
I deliberately put my govenor to the conservative one, as I hated fans spinning up for a second and then down again repeatedly. Much rather sacrifice a bit of battery and speed for quiet.
SirMaster19 hours ago
Can't you just cap the fan speed? Or does it actually get too hot at a lower fan speed to where it would throttle or crash?
magicalhippo12 hours ago
I wanted the full power when doing long compiles and such. Just not the fan jojo acion when neowsing the web or writing.
Also swapping the governor was trivial and reliable. Modifying fan profiles has always been a bit of a struggle for me, with huge differences in hardware support, persistence etc.
porridgeraisin11 hours ago
> jojo acion when neowsing
jumping into action when browsing
magicalhippo4 hours ago
Thanks. I hate the autocorrect as it's so often wrong, but hitting the right "keys" with no tactile feedback is such a pain. I miss T9...
MBCooka day ago
Smart. That would drive me nuts too.
saagarjhaa day ago
Yes, this is pretty normal; your processor will downclock to accommodate. For HPC where the workloads are pretty clearly defined it’s possible to even measure how close you’re coming to the thermal envelope and adjust the workload.
throwaway31131a day ago
Percent utilization for most operating systems is the amount of time the idle task is not scheduled. So for both workloads the idle task was never scheduled, hence 100% "utilization".
BrendanLongop2 days ago
Some esoteric methods of measuring CPU utilizations are to calculate either the current power usage over the max available power, or the current temperature over the max operating temperature. Unfortunately these are typically even more non-linear than the standard metrics (but they can be useful sometimes).
gblargg2 days ago
Like measuring RMS of an AC voltage by running it through a heating element: https://wikipedia.org/wiki/True_RMS_converter#Thermal_conver...
PunchyHamstera day ago
except it doesn't really tell you much, because having some parts of CPUs underutilized doesn't mean adding load will utilize them. Like if load underutilizes floating point units and you have nothing else that uses them
inetknghta day ago
> Like if load underutilizes floating point units
This is why I sigh really hard when people talk about some measurement of FLOPS per second, as if it's the only thing that matters.
It matters. Perhaps it matters a lot for specific workloads. But most general workloads are integer-based.
colejohnson66a day ago
But *sparkle emoji* AI *sparkle emoji*
kqra day ago
Also there's dark silicon to consider – the CPU simply cannot for thermal reasons run power to all parts of itself at the same time.
[deleted]2 days agocollapsed
[deleted]2 days agocollapsed
kqr2 days ago
It might be a lie, but it surely is a practical one. In my brief foray into site reliability engineering I used CPU utilisation (of CPU-bofund tasks) with queueing theory to choose how to scale servers before big events.
The %CPU suggestions ran contrary to (and were much more conservative than) the "old wisdom" that would otherwise have been used. It worked out great at much lower cost than otherwise.
What I'm trying to say is you shouldn't be afraid of using semi-crappy indicators just because they're semi-crappy. If it's the best you got it might be good enough anyway.
In the case of CPU utilisation, though, the number in production shouldn't go above 40 % for many reasons. At 40 % there's usually still a little headroom. The mistake of the author was not using fundamentals of queueing theory to avoid high utilisation!
therealdrag0a day ago
> semi-crappy indicator … good enough.
Agree. Another example of this is for metrics as percentiles per host that you have to average, vs histograms per host that get percentile calculated at aggregation time among hosts. Sure an avg/max of a percentile is technically not a percentile, but in practice switching between one or the other hasn’t affected my operations at all. Yet I know some people are adamant about mathematical correctness as if that translates to operations.
arccya day ago
That works ok when you have evenly distributed load (which you want / would hope to have), much less so when your workload is highly unbalanced.
mayama2 days ago
Combination of CPU% and loadavg would generally tell how system is doing. I had systems where loadavg is high, waiting on network/io, but little cpu%. Tracing high load is not always straightforward as cpu% though, you have to go through io%, net%, syscalls etc.
saagarjhaa day ago
40% seems quite lightly utilized tbh
cpncruncha day ago
I tend to use 50% as a soft target, which seems like a good compromise. Sometimes it may go a little bit over that, but if it's occasional it shouldn't be an issue.
It's not good to go much over 50% on a server (assuming half the cpus are just hyperthreads), because you're essentially relying on your load being able to share the actual cpu cores. At some point, when the load increases too much, there may not be any headroom left for sharing those physical cpus. You then get to the point where adding a little bit more load to 80% suddenly results in 95% utilization.
kqra day ago
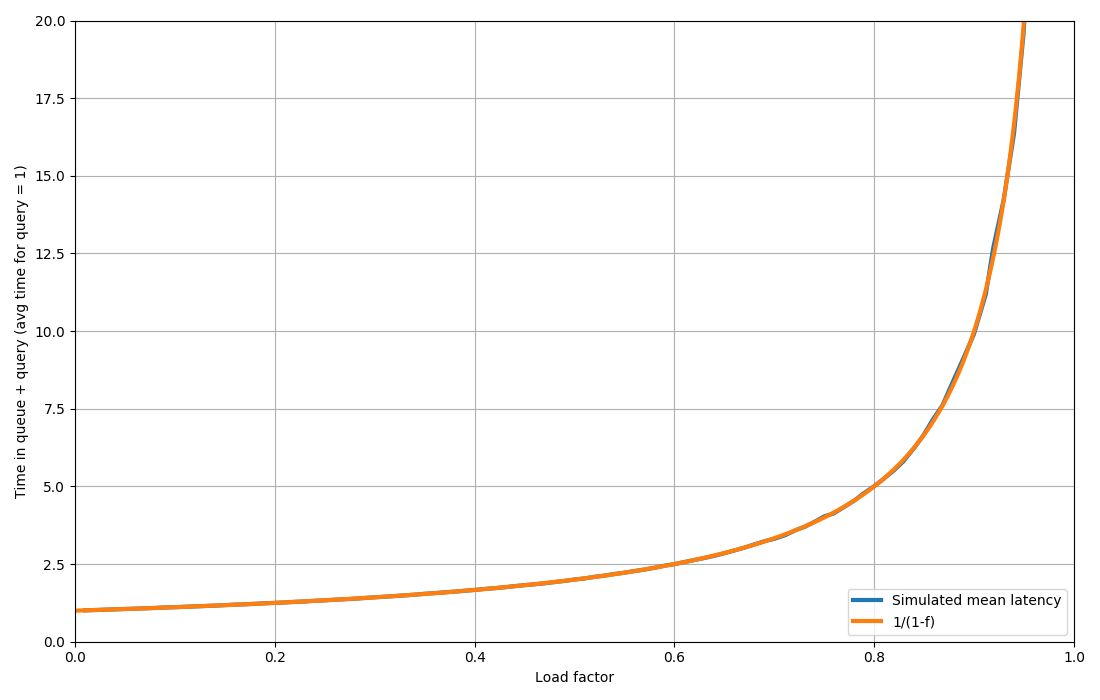
It depends on how variable the load is, compared to how fast the servers can scale up and down, etc. I often have as a rule of thumb to have enough headroom to be able to deal with twice the load while staying within a triple of the response time. You can solve the equations for your specific case, but eyeballing graphs such as [1] I end up somewhere in the area of 40 %.
The important part is of course to ask yourself the question "how much increased load may I need to handle, and how much can I degrade system performance in doing so?" You may work in an industry that only ever sees 10 % additional load at timescales where scaling is unfeasible, and then you can pick a significantly higher normal utilisation level. Or maybe you're in an industry where you cannot degrade performance by more than 10 % even if hit by five times the load – then you need a much, much more conservative target for utilisation.
paravz21 hours ago
Cpu utilization %% needs to be contrasted with a "business" metric like latency or RPS. Depending on the environment and hardware 40% can be too utilized or way underutilized
zekrioca2 days ago
I noticed exactly the same thing. The author is saying something that has been repeatedly written in queueing theory books for decades, still they are noticing this only now.
mustache_kimono2 days ago
Reminds me of Brendan Gregg's "CPU Utilization is Wrong" but this blog fails to discuss that blog's key point that CPU utilization is a measure of whether or not the CPU is busy, including whether the CPU is waiting [0]. That blog also explains that the IPC (instructions per cycle) metric actually measures useful work hidden within that busy state.
[0]: https://www.brendangregg.com/blog/2017-05-09/cpu-utilization...
4gotunameagaina day ago
What's up with Brendans and CPU utilisation concerns, any Brendan to shine some light ?
BrendanLongopa day ago
I'd love to explain, but you'd need to change your name to Brendan first.
PaulKeeble2 days ago
This is bang on, you can't count the hyperthreads as double the performance, typically they are actually in practice only going to bring 15-30% if the job works well with it and their use will double the latency. Failing to account for loss in clockspeed as the core utilisation climbs is another way its not linear and in modern software for the desktop its really something to pay careful attention to.
It should be possible from the information you can get on a CPU from the OS to better estimate utilisation involving at the very least these two factors. It becomes a bit more tricky to start to account for significantly going past the cache or available memory bandwidth and the potential drop in performance to existing threads that occurs from the increased pipeline stalls. But it can definitely be done better than it is currently.
c2h5oh2 days ago
To complicate things more HT performance varies wildly between CPU architectures and workloads. e.g. AMD implementation, especially in later Zen cores, is closer to a performance of a full thread than you'd see in Intel CPUs. Provided you are not memory bandwidth starved.
RaftPeoplea day ago
> To complicate things more HT performance varies wildly between CPU architectures and workloads.
IBM's Power cpu's have also traditionally done a great job with SMT compared to Intel's implementation.
shim__a day ago
Whats the difference between Intels and AMDs approach?
richardwhiuka day ago
Basically it comes down to how much shared vs dedicated resources each core has.
magicalhippoa day ago
For memory-bound applications the scaling can be much better. A renderer I worked on was primarily memory-bound walking the accelerator structure, and saw 60-70% increase from hyperthreads.
But overall yeah.
Sohcahtoa82a day ago
Back when I got an i7-3770K (4C/8T), I did a very basic benchmark using POV-Ray.
Going from 1 thread to 2 threads doubled the speed as expected. Going from 2 to 4 doubled it again. Going from 4 to 8 was only ~15% faster.
I imagine you could probably create a contrived benchmark that actually gives you nearly double the performance from SMT, but I don't know what it would look like. Maybe some benchmark that is written to deliberately constantly miss cache?
Side note, I should run that POV-Ray test again. It's been years since I've even use POV-Ray.
tgma2 days ago
The way they refer to cores in their system is confusing and non-standard. The author talks about a 5900X as a 24 core machine and discusses as if there are 24 cores, 12 of which are piggybacking on the other 12. In reality, there are 24 hyperthreads that are pretty much pairwise symmetric that execute on top of 12 cores with two sets of instruction pipeline sharing same underlying functional units.
saghm2 days ago
Years ago, when trying to explain hyper threading to my brother, who doesn't have any specialized technical knowledge, he came up with the analogy that it's like 2-ply toilet paper. You don't quite have 24 distinct things, but you have 12 that are roughly twice as useful as the individual ones, although you can't really separate them and expect them to work right.
nayuki2 days ago
Nah, it's easier than that. Putting two chefs in the same kitchen doesn't let you cook twice the amount of food in the same amount of time, because sometimes the two chefs need to use the same resource at the same time - e.g. sink, counter space, oven. But, the additional chef does improve the utilization of the kitchen equipment, leaving fewer things unused.
whizztera day ago
Maybe simplify more to make the concept of shared resource explicit.
2 chefs with one stove. As long as they're doing other things than frying it's ok and speeding things up but once they both need the stove you're down to 1 working and 1 waiting.
BobbyTables22 days ago
That’s perfect!
Especially when it come to those advertisements “6 large rolls == 18 normal rolls”.
Sure it might be thicker but nobody wipes their butt with 1/3 a square…
skeezyboya day ago
> he came up with the analogy that it's like 2-ply toilet paper.
as in youd only use it to wipe excrement from around your sphincter
BrendanLongop2 days ago
Thanks for the feedback. I think you're right, so I changed a bunch of references and updated the description of the processor to 12 core / 24 thread. In some cases, I still think "cores" is the right terminology though, since my OS (confusingly) reports utilization as-if I had 24 cores.
sroussey2 days ago
Eh, what’s a thread really? It’s a term for us humans.
The difference between two threads and one core or two cores with shared resources?
Nothing is really all that neat and clean.
It more of a 2 level NUMA type architecture with 2 sets of 6 SMP sets of 2.
The scheduler may look at it that way (depending), but to the end user? Or even to most of the system? Nah.
tgma2 days ago
There are observable differences. For example, under HT, TLB flush or context switch will likely be observable by a neighboring thread whereas for in a full dedicated core, you won't observe such things.
sroussey2 days ago
Will be interesting when (if?) Intel ships software defined cores which are the logical inverse of hyper threading.
Instead of having a big core with two instruction pipelines sharing big ALUs etc, they have two (or more) cores that combine resources and become one core.
Almost the same, yet quite different.
tgma2 days ago
There was the dreaded AMD FX chip which was advertised as 8 core, but shared functional units. Got sued, etc.
hedora2 days ago
That patent seems to be describing a dumb way to implement pipelining / speculative execution. Am I missing something?
Anyway, by my reading, it’s also similar to the Itanic, er, Itanium, where the “cores” that got combined were pipeline stages.
tgma2 days ago
I did not read the patent (do not read patents as a matter of policy.) Was simply responding to the second paragraph that kind of reminded me of FX Bulldozer chips.
Neil44a day ago
If both SMT cores are being asked to do the same workload they will likely contend for the same resource and execution units internally so the boost from SMT will be less. If they have different workloads the boost will be more. Now throw in P and E cores on newer CPU's, turbo and non-turbo, everything gets very complicated. I did see a study that adding SMT got a much better performance per watt boost than adding turbo which was interesting/useful.
freehorsea day ago
Author discovers that performance does not scale proportionally to %CPU utilisation, and gets instead to the conclusion that %CPU utilisation is a lie.
There are many reasons for the lack of a proportional relationship, even in the case where you do not have hyperthreading or downclocking (in which cases you just need to interpret %CPU utilisation in that context, rather than declare it "a lie"). Even in apple silicon where these are usually not an issue, you often do not get an exactly proportional scaling. There may be overheads when utilising multiple cores wrt how data is passed around, or resource bottlenecks other than CPU.
saagarjhaa day ago
Apple silicon downclocks quite a lot especially if you have a passively cooled machine
freehorsea day ago
With the exception of macbook air that has passive cooling nothing as aggressive as "turbo" modes, and ime it is relatively hard to get to thermal limits just with cpu in general for the devices I have used. Most other manufacturers nowadays officially advertise boosted single core clock speeds that are much higher and lower when more cores are used at the same time. Thermal limits, in contrast, are much more circumstantial.
judge1232 days ago
This hits so close to home. I once tried to explain to a manager that a server at 60% utilization had zero room left, and they looked at me like I had two heads. I wish I had this article back then!
hinkley2 days ago
You also want to hit him with queueing theory.
Up to a hair over 60% utilization the queuing delays on any work queue remain essentially negligible. At 70 they become noticeable, and at 80% they've doubled. And then it just turns into a shitshow from there on.
The rule of thumb is 60% is zero, and 80% is the inflection point where delays go exponential.
The biggest cluster I ran, we hit about 65% CPU at our target P95 time, which is pretty much right on the theoretical mark.
BrendanLongop2 days ago
A big part of this is that CPU utilization metrics are frequently averaged over a long period of time (like a minute), but if your SLO is 100 ms, what you care about is whether there's any ~100 ms period where CPU utilization is at 100%. Measuring p99 (or even p100) CPU utilization can make this a lot more visible.
hinkley2 days ago
The vertical for this company was one where the daily traffic was oddly regular. That the two lines matched expectations likely has to do with the smoothness of the load.
The biggest problem was not variance in request rate it was variance in request cost, which is usually where queuing kicks in, unless you're being dumb about things. I think for a lot of apps p98 is probably a better metric to chase, p99 and p100 are useful for understanding your application better, but I'm not sure you want your bosses to fixate on them.
But our contracts were for p95, which was fortunate given the workload, or at least whoever made the contracts got good advice from the engineering team.
kccqzy2 days ago
If your SLO is 100 ms you need far more granular measurement periods than that. You should measure the p99 or p100 utilization for every 5-ms interval or so.
[deleted]a day agocollapsed
Ambroisiea day ago
Do you have a link to a more in-depth analysis of the queuing theory for these numbers?
hinkleya day ago
I can picture charts from various treatments in my head but none of the names stick.
I really should have a favorite couple of links or books but unfortunately I do not. I will put that on my todo list.
The magic search terms are “queue size/length”, “utilization”.
PunchyHamstera day ago
that entirely depends on workload. especially now when average server CPUs start at 32 cores
[deleted]2 days agocollapsed
dragontamer2 days ago
There's many ways CPU utilization fails to work as expected.
I didn't expect an article on this style. I was expecting the normal Linux/Windows utilization but wtf it's all RAM bottlenecked and the CPU is actually quiet and possibly down clocking thing.
CPU Utilization is only how many cores are given threads to run by the OS (be it Windows or Linux). Those threads could be 100% blocked on memcpy but that's still CPU utilization.
-------
Hyperthreads help: if one thread is truly CPU bound (or even more specifically: AVX / Vector unit bound), while a 2nd thread is hyperthreaded together that's memcpy / RAM bound, you'll magically get more performance due to higher utilization of resources. (Load/store units are separate from AVX compute units).
In any case, this is a perennial subject with always new discoveries about how CPU Utilization is far less intuitive than many think. Still kinda fun to learn about new perspectives on this matter in any case.
0xbadcafebee2 days ago
The benchmark is basically application performance testing, which is the most accurate representation you can get. Test the specific app(s) your server is running, with real-world data/scenarios, and keep cranking up the requests, until the server falls over. Nothing else will give you as accurate an indication of your server's actual maximum performance with that app. Do that for every variable that's relevant (# requests/s, payload size, # parameters, etc), so you have multiple real-world maximum-performance indicators to configure your observability monitors for.
One way to get closer to reliable performance is to apply cpu scheduler limits to what runs your applications to keep them below a given threshold. This way you can better ensure you can sustain a given amount of performance. You don't want to run at 100% cpu for long, especially if disk i/o becomes hampered, system load skyrockets, and availability starts to plummet. Two thousand servers with 5000ms ping times due to system load is not a fun day at the office.
(And actually you'll never get a completely accurate view, as performance can change per-server. Rack two identical servers in two different racks, run the same app on each, and you may see different real-world performance. One rack may be hotter than the other, there could be hidden hardware or firmware differences, etc. Even within a server, if one CPU is just nearer a hotter component than on another server, for reasons)
CCs2 days ago
Uses stress-ng for benchmarking, even though the stress-ng documentation says it is not suitable for benchmarking. It was written to max out one component until it burns. Using a real app, like Memcached or Postgres would show more realistic numbers, closer to what people use in production. The difference is not major, 50% utilization is closer to 80% in real load, but it breaks down faster. Stress-ng is nicely linear until 100%, memcached will have a hockey stick curve at the end.
BrendanLongop2 days ago
The advantage of stress-ng is that it's easy to make it run with specific CPU utilization numbers. The tests where I run some number of workers at 100% utilization are interesting since they give such perfect graphs, but I think the version where I have 24 workers and increase their utilization slowly is more realistic for showing how production CPU utilization changes.
BrendanLongop2 days ago
Fun data point though, I just ran three data points of the Phoronix nginx benchmark and got these results:
- Pinned to 6 cores: 28k QPS
- Pinned to 12 cores: 56k QPS
- All 24 cores: 62k QPS
I'm not sure how this applies to realistic workloads where you're using all of the cores but not maxing them out, but it looks like hyperthreading only adds ~10% performance in this case.
PunchyHamstera day ago
I'd imagine in this case it's just uncounted usage from OS networking stack
justsomehnguy2 days ago
You missed to try 18 cores.
swiftcoder2 days ago
I remember being stuck in a discussion with management one time, that went something like this: Manager: CPU utilisation is 100% under load! We have to migrate to bigger instances. Me: but is the CPU actually doing useful work?
(chat, it was not. busy waiting is CPU utilisation too)
kristianp9 hours ago
How do you measure the amount of busy waiting?
swiftcoder6 hours ago
I don't think there is a good general tool for this. In this specific case, I went spelunking for all the points where we had thread contention over resources, and discovered that for several resources quite a lot of CPU cycles were being expended to no use. The goal is really to eliminate the underlying resource contention - we added per-thread caches I various places, swapped out the logging system, and were able to ~double the system throughput during times when top showed the system to be "fully loaded"
aaa_20062 hours ago
CPU utilization alone is misleading. Pair it with per core load average or runqueue length to see how threads are actually queuing. That view often reveals the real bottleneck, whether it is I/O, memory, or scheduling delays.
ChaoPrayaWave2 days ago
These days I treat CPU usage as just a hint, not a conclusion. I also look at response times, queue lengths, and try to figure out what the app is actually doing when it looks idle.
kristopolous2 days ago
Tried to explain this in a job interview 5 years ago. They thought I was a bullshitter
bionsystem2 days ago
Happened to me on a different topic, felt bad for way too long ; in hindsight I'm pretty sure I dodged a bullet.
kristopolousa day ago
This was the same interview where some guy was asking me about "big-o" - like the thing that you teach 19 year olds and I was saying that parallelization matters, i/o matters, quantization matters, whether you can run it on the GPU, these all matter.
The simple "big-o" number doesn't account for whether you need to pass terabytes over the bus for every operation - and on actual computers moving around terabytes, I know, shockingly, this affects performance.
And if you have a dual epyc board with 1,024 threads, being able to parallelize a solution and design things for cache optimization, this isn't meaningless.
It's a weak classifier - if you really think I'm going to be doing a lexical sort in like O(n^3) like some kind of clown, I don't know what you're hiring here.
Found out later he scored me "2/5".
Alright, cool.
kiitosa day ago
"big o" usually refers to algorithmic complexity, which is something entirely orthogonal to all of the dimensions you mentioned
obviously all of this stuff matters in the end but big-o comes before all of those other things
morning-coffeea day ago
The lie is that hyper thread "cores" are equal to real "cores". Maybe this is what happens when an over 20-year old technology (hack) becomes ubiquitous and gets forgotten about? (We have to rediscover why our performance measurements don't seem to make sense?)
The other thing I think we have a hard time visualizing is that processor is only either executing (100%) or its waiting to execute (0%) and that happens over varying timescales... so trying to assign a % in between inherently means you're averaging over some arbitrary timescale...
hinkley2 days ago
How many times has hyperthreading been an actual performance benefit in processors? I cannot count how many times an article has come out saying you'll get better performance out of your <insert processor here> by turning off hyperthreading in the BIOS.
It's gotta be at least 2 out of every 3 chip generations going back to the original implementation, where you're better off without it than with.
loeg2 days ago
HT provides a significant benefit to many workloads. The use cases that benefit from actually disabling HT are likely working around pessimal OS scheduler or application thread use. (After all, even with it enabled, you're free to not use the sibling cores.) Otherwise, it is an overgeneralization to say that disabling it will benefit arbitrary workloads.
hedora2 days ago
There’s some argument that you should jam stuff on to as few hyperthread pairs as possible to improve energy efficiency and cache locality.
Of course, if the CPU governor is set to “performance” or “game mode”, then the OS should use as many pairs as possible instead (unless thermal throttling matters; computers are hard).
mkbosmans2 days ago
Especially in HPC there are lots of workloads that do not benefit from SMT. Such workloads are almost always bottlenecked on either memory bandwidth or vector execution ports. These are exactly the resources that are shared between the sibling threads.
So now you have a choice of either disabling SMT in the bios, or make sure the application correctly interprets the CPU topology and only spawns one thread per physical core. The former is often the easier option, both from software development and system administration perspective.
PunchyHamstera day ago
HT cores can still run OS stuff in that case as that isn't really in contention with those. Tho I can see someone not wanting to bother with pinning
skeezyboya day ago
>Especially in HPC there are lots of workloads that do not benefit from SMT...So now you have a choice of either disabling SMT in the bios
Thats madness. Theyre cheaper than their all-core equivalent. Why even buy one in the first place if HT slows down the CPU? Youre still better off with them enabled.
robocat2 days ago
> use cases that benefit from actually disabling HT
Other benefits: per-CPU software licencing sometimes, and security on servers that share CPU with multiple clients.
twoodfin2 days ago
For whatever it’s worth, operational database systems (many users/connections, unpredictable access patterns) are beneficiaries of modern hyperthreading.
I’m familiar with one such system where the throughput benefit is ~15%, which is a big deal for a BIOS flag.
IBM’s POWER would have been discontinued a decade ago were it not for transactional database systems, and that architecture is heavily invested in SMT, up to 8-way(!)
tom_2 days ago
Why do they need so many threads? This really feels like they just designed the cpu poorly, in that it can't extract enough parallelism out of the instruction stream already.
(Intel and AMD stopped at 2! Apparently more wasn't worth it for them. Presumably because the cpu was doing enough of the right thing already.)
ckozlowski2 days ago
As I recall it, Intel brought about Hyperthreading on Northwood and later Pentium 4s as a way to help with issues in it's long pipeline. As I remember it described at the time, P4 had 30+ stages in it's pipeline. Many of them did not need to be used in a given thread. Furthermore, if a branch prediction engine guessed wrong, then the pipeline needed to be cleared and started anew. For a 30+ stage pipeline, that's a lot of wasted clock cycles.
So hyper-threading was a way to recoup some of those losses. I recall reading at the time that it was a "latency hiding technique". How effective it was I leave to others. But it became standard it seems on all x86 processors in time. Core and Core 2 didn't seem to need it (much shorter pipelines) but later Intel and AMD processors got it.
This is how it was explained to me at the time anyways. I was working at an OEM from '02-'05, and I recall when this feature came out. I pulled out my copy of "Inside the Machine" by Jon Stokes which goes deep into the P4 architecture, but strangely I can only find a single mention of hyperthreading in the book. But it goes far into the P4 architecture and why branch misses are so punishing. It's a good read.
Edit: Adding that I suspect instruction pipelines are not so long that adding additional threads would help. I suspect diminishing returns past 2.
justsomehnguy2 days ago
> As I recall it, Intel brought about Hyperthreading on Northwood and later Pentium 4s as a way to help with issues in it's long pipeline.
Well, Intel brought Hyperthreading to Xeon first and they were quite slow, so the additional thread performance were quite welcome there.
But the GHz race was lead to the monstruosity of 3.06GHz CPUs where the improvement in speed didn't quite translated to the improvement in performance. And while the Northwood fared well (especially considering the disaster of Willamette) GHz/performance wise, the Prescott wasn't and mostly showed the same performance in non-SSE/cache bound tasks[1], so Intel needed to push the GHz further which required a longer pipeline and brought even more penalty on a prediction miss.
Well, at least this is how I remember it.
[0] https://en.wikipedia.org/wiki/List_of_Intel_Xeon_processors_...
[1] but excelled in the room heating, people joked what they even didn't bother with an apartment heating in winter, just leaving a computer running
bee_rider2 days ago
Any time somebody mentions the Pentium 4, it feels like a peek at a time-line we didn’t end up going down. Imagine if Intel had stuck to their guns, maybe they could have pushed through and we’d have CPUs with ridiculous 90 stage pipelines, and like 4 threads per core. Maybe frameworks, languages, and programmer experience would have conspired to help write programs with threads that work together very closely, taking advantage of the shared cache of the hyperthreads.
I mean, it obviously didn’t happen, but it is fun to wonder about.
TristanBall2 days ago
I suspect part of it is licensing games, both in the sense of "avoiding per core license limits" which absolutely matters when your DB is costing a million bucks, and also in the 'enable the highest PVU score per chassis' for ibm's own license farming.
Power systems tend not to be under the same budget constraints as intel, whether thats money, power, heat, whatever, so the cost benifit of adding more sub-core processing for incremental gains is likely different too.
I may have a raft of issues with IBM, and aix, but those Power chips are top notch.
hinkley2 days ago
Yeah that was another thing. You run Oracle you gotta turn that shit off in the BIOS otherwise you're getting charged 2x for 20% more performance.
wmf2 days ago
AFAIK Oracle does not charge extra for SMT.
twoodfina day ago
Low-latency databases are architected to be memory-bandwidth bound. SMT allows more connections to be generating more loads faster, utilizing more memory bandwidth.
Think async or green threads, but for memory or branch misses rather than blocking I/O.
(As mentioned elsewhere, optimizing for vendor licensing practices is a nice side benefit, but obviously if the vendors want $X for Y compute on their database, they’ll charge that somehow.)
wmf2 days ago
Power does have higher memory latency because of OMI and it supports more sockets. But I think the main motivation for SMT8 is low-IPC spaghetti code.
jiggawatts2 days ago
I've noticed an overreliance on throughput as measured during 100% load as the performance metric, which has resulted in hardware vendors "optimising to the test" at the expense of other, arguably more important metrics. For example: single-user latency when the server is just 50% loaded.
twoodfin2 days ago
That’s more than fair.
In the system I’m most familiar with, however, the benefits of hyperthreading for throughput extend to the 50-70% utilization band where p99 latency is not stressed.
hinkley2 days ago
Or p98 time for requests. Throughput and latency are usually at odds with each other.
BrendanLongop2 days ago
To be fair, in most of these tests hyperthreading did provide a significant benefit (in the general CPU stress test, the hyperthreads increased performance by ~66%). It's just confusing that utilization metrics treat hyperthread usage the same as full physical cores.
bee_rider2 days ago
Those weird Xeon Phi accelerators had 4 threads per core, and IIRC needed at least 2 running to get full performance. They were sort of niche, though.
I guess in general parallelism inside a core will either be extracted by the computer automatically with instruction-level-parallelism, or the programmer can tell it about independent tasks, using hyperthreads. So the hyperthread implementations are optimistic about how much progrmmers care about performance, haha.
mkbosmans2 days ago
Sort of niche indeed.
In addition to needing SMT to get full performance, there were a lot of other small details you needed to get right on Xeon Phi to get close to the advertised performance. Think of AVX512 and the HBM.
For practical applications, it never really delivered.
tgma2 days ago
It has a lot to do with your workload as well as if not moreso than the chip architecture.
The primary trade-off is the cache utilization when executing two sets of instruction streams.
hinkley2 days ago
That's likely the primary factor, but then there's thermal throttling as well. You can't run all of the logic units flat out on a bunch of models of CPU.
tgma2 days ago
May be true for FMA or AVX2 or similar stuff. Outside vector units that sounds implausible. Obviously multi core thermal throttling is a thing but that would by far dominate. Hyperthreading should have minimal impact there.
gruez2 days ago
>but then there's thermal throttling as well. You can't run all of the logic units flat out on a bunch of models of CPU.
That doesn't make any sense. Disabling SMT likely saves negligible amount of power, but disables any performance to be gained from the other thread. If there's thermal budget available, it's better to spend it by shoving more work onto the second thread than to leave it disabled. If anything, due to voltage/frequency curves, it might even be better to run your CPU at lower clocks but with SMT enabled to make up for it (assuming it's amenable to your workloads), than it is to run with SMT disabled.
duped2 days ago
For me today it's definitely a pessimation because I have enough well-meaning applications that spawn `nproc` worker threads. Which would be fine if they're the only process running, but they're not.
hinkley2 days ago
I wrote a little tool for our services that could do basic expression based off of nproc based on an environment variable at startup time.
You could do one thread for every two cores, three threads for every 2 cores, one thread per core ± 1, or both (2n + 1).
Unfortunately the sweet spot based on our memory usage always came out to 1:1, except for a while when we had a memory leak that was surprisingly hard to fix, and we ran n - 1 for about 4 months while a bunch of work and exploratory testing were done. We had to tune in other places to maximize throughput.
toast02 days ago
Wouldn't that be about the same badness without hyperthreads? If you're oversubscribed, there might be some benefit to having fewer tasks, but maybe you get some good throughput with two different application's threads running on opposite hyperthreads.
hinkley2 days ago
Oversubscribing also leads to process migration, which these days leads to memory read delays.
esseph2 days ago
Intel vs AMD, you'll get a different answer on the hyperthreading question.
https://www.tomshardware.com/pc-components/cpus/zen-4-smt-fo...
toast02 days ago
Going from 1 core to 2 hyperthreads was a big bonus in interactivity. But I think it was easy to get early systems to show worse throughput.
I think there's two kinds of loads where hyperthreads aren't more likely to hurt than help. If you've got a tight loop that uses all the processor execution resources, you're not gaining anything by splitting that in two, it just makes things harder. Or if your load is mostly bound by memory bandwidth without a lot of compute... having more threads probably means you're that much more oversubscribed on i/o and caching.
But a lot of loads are grab some stuff from memory and then do some compute, rinse and repeat. There's a lot of potential for idle time while waiting on a load, being able to run something else during that time makes a lot of sense.
It's worth checking how your load performs with hyperthreads off, but I think default on is probably the right choice.
sroussey2 days ago
Definitely measure both ways and decide.
For many years (still?) it was faster to run your database with hyper threading turned off and your app server with it turned on.
tom_2 days ago
Total throughout has always seemed better with it switched on for me, even for stuff that isn't hyper threading friendly. You get a free 10% at least.
FpUser2 days ago
In the old days it had made the difference between my multimedia game like application not working at all with hyperthreading off to working just fine with it on.
hinkley2 days ago
Yeah when it was one core versus 1.3 cores that's fair. But 3 core machines often did better (or at least more consistently run to run) with HT disabled.
Aissena day ago
Funny that it talks about matrixprod, which I think is not that relevant as benchmark — unless you care about x87 performance specifically. I recently sent a pull request to try to address that in a generic manner: https://github.com/ColinIanKing/stress-ng/pull/561
Yet I'm still surprised by this benchmark. On both Zen2 and Zen4 in my tests (5900X from the article is Zen3), matrixprod still benefits from hyperthreading and scales a bit after all the physical cores are filled, unlike what the article results show.
All of this is tangential of course, as I'd tend to agree that CPU utilization% is just an imprecise metric and should only be used as a measure of "is something running".
bob1029a day ago
I think looking at power consumption is potentially a more interesting canary when using very high core count parts.
I've ran some ML experiments on my 5950x and I can tell that the CPU utilization figure is entirely decoupled from physical reality by observing the amount of flicker induced in my office lighting by the PWM noise in the machine. There are some code paths that show 10% utilization across all cores but make the cicadas outside my office window stop buzzing because the semiconductors get so loud. Other code paths show all cores 100% maxed flatline and it's like the machine isn't even on.
fennecfoxya day ago
I think it's more for cores, right? % util is just % of idle cycles across all logical cores as far as I know.
It wouldn't really make sense to include all parts of the CPU in the calculation.
N_Lens2 days ago
This has been my experience running production workloads as well. Anytime CPU% goes over 50-60% suddenly it'll spike to 100% rather quickly, and the app/service is unusable. Learned to scale earlier than first thought.
tonymeta day ago
I like his empirical approach to get to the root significance of the cpu %-age indicator. Software engineers and data analysts take discrete "data" measurements and statistics for granted.
"data" / "stats" are only a report, and that report is often incorrect.
codedokodea day ago
A worse lie is memory usage reporting, I think in every major OS it is understated and misreported. In case with Linux, I wanted to know who is using memory, and tried to add PSS values for every process, I never got back the total memory usage. In case with Windows/Mac I judge by screenshot of their tools which show unrealistically small values.
As for the article, the slowdown can be also caused by increased use of shared resources like caches, TLBs, branch predictors.
biggusdickus6920 hours ago
The memory usage is interesting, where different kind of shared memory is obvious hard to visualize, just two values per process doesn’t say enough.
Most users actually wants a list of ”what can I kill to make the computer faster”, I.e. they want an oracle (no pun) that knows how fast the computer will be if different processes are killed.
rollcata day ago
I'm surprised nobody has mentioned OpenBSD yet.
They've been advocating against SMT for a long while, citing security risks and inconsistent performance gains. I don't know which HW/CPU bug in the long series of rowhammer, meltdown, spectre, etc prompted the action, but they've completely disabled SMT in the default installation at some point.
The core idea by itself is fine: keep the ALUs busy. Maybe security-wise, the present trade-off is acceptable, if you can instruct the scheduler to put threads from the same security domain on the same physical core. (How to tell when two threads are not a threat to each other is left up as an exercise.)
saagarjhaa day ago
The security argument might make sense but OpenBSD is not really the place to take performance advice from
rollcata day ago
My original point stands, also per TFA - performance gains from SMT are questionable for certain workloads. Whether OpenBSD prioritises absolute performance is besides the point - they benchmark against their own goals, not someone else's achievements.
whizztera day ago
Do people even use or mention OpenBSD out of performance concerns? We all know they prioritize security.
gbin2 days ago
Yeah and those tests don't even trigger some memory or cache contention ...
smallstepforman2 days ago
Read kernel code to see how CPU utilisation is calculated. In essence, count scheduled threads to execute and divide by number of cores. Any latency (eg. wait for memory) is still calculated as busy core.
HPsquareda day ago
GPU utilisation as reported in Task Manager also seems quite a big lie, it bears little relation to Watts / TDP.
PathOfEclipsea day ago
I think it was always a mistake to pretend hyperthreading doubles your core count. I always assumed it was just due to laziness; the operating system treats a hyperthreaded core as two "virtual cores" and schedules as two cores, so then every other piece of tooling sees double the number of actual cores. There's no good reason I know of that a CPU utilization tool shouldn't use real cores when calculating percentages. But, maybe that's hard to do given how the OS implements hyperthreading.
fluoridationa day ago
>There's no good reason I know of that a CPU utilization tool shouldn't use real cores when calculating percentages
On AMD, threads may as well be cores. If you take a Ryzen and disable SMT, you're basically halving its parallelism, at least for some tasks. On Intel you're just turning off an extra 10-20%.
PathOfEclipsea day ago
Can you provide some links for this? A quick web search turns this up at near the top from 2024:
https://www.techpowerup.com/review/amd-ryzen-9-9700x-perform...
The benchmarks show a 10% drop in "application" performance when SMT is disabled, but an overall 1-3% increase in performance for games.
From a hardware perspective, I can't imagine how it could be physically possible to double performance by enabling SMT.
fluoridation20 hours ago
I don't. It's based off my own testing, not by disabling SMT, but by running either <core_count> or <thread_count> parallel threads. It was my own code, so it's possible code that uses SIMD more heavily will see a less-significant speed-up. It's also possible I just measured wrong; running Cargo on a directory with -j16 and -j32 takes 58 and 48 seconds respectively.
>From a hardware perspective, I can't imagine how it could be physically possible to double performance by enabling SMT.
It depends on which parts of the processor your code uses. SMT works by duplicating some but not all the components of each core, so a single core can work on multiple independent uops simultaneously. I don't know the specifics, but I can imagine ALU-type code (jumps, calls, movs, etc.) benefits more from SMT than very math-heavy code. That would explain why rustc saw a greater speedup than Cinebench, as compiler code is very twisty with not a lot of math.
steventhedev2 days ago
%cpu is misleading at best, and should largely be considered harmful.
System load is well defined, matches user expectations, and covers several edge cases (auditd going crazy, broken CPU timers, etc).
pama2 days ago
Wait until you encounter GPU utilization. You could have two codes listing 100% utilization and have well over 100x performance difference from each other. The name of these metrics creates natural assumptions that are just wrong. Luckily it is relatively easy to estimate the FLOP/s throughput for most GPU codes and then simply compare to the theoretical peak performance of the hardware.
spindump89302 days ago
Don't forget that theoretical peak performance is (probably) half the performance listed on the nvidia datasheet because they used the "with sparsity" numbers! I've seen this bite folks who miss the * on the figure or aren't used to reading those spec sheets.
BrendanLongop2 days ago
Yeah, the obvious thing with processors is to do something similar:
(1) Measure MIPS with perf (2) Compare that to max MIPS for your processor
Unfortunately, MIPS is too vague since the amount of work done depends on the instruction, and there's no good way to measure max MIPS for most processors. (╯°□°)╯︵ ┻━┻
saagarjhaa day ago
If your workload is compute bound, of course. Sometimes you want to look at bandwidth instead.
pamaa day ago
Of course. Lots of useful metrics exist to help tweak code performance without always needing to go into detailed profiler traces. GPU utilization is a particularly poor metric in helping much, except for making sure the code made it to the GPU somehow :-)
throwmeaway2222 days ago
Yeah, this is what we all talked about when hyperthreading was first invented in 2000 era.
[deleted]a day agocollapsed
bdhcuidbebea day ago
Thats some strong words about not RTFM.
1gn152 days ago
Love that this website is public domain. Thank you, Brendan!
[deleted]2 days agocollapsed
[deleted]2 days agocollapsed
fuzzfactora day ago
Windows users try this:
Ctrl-Alt-Del then launch TaskManager.
In TaskManager, click the "Performance" tab and see the simple stats.
While on the Performance tab, then click the ellipsis (. . .) menu, so you can then open ResourceMonitor.
Then close TaskManager.
In ResourceMonitor, under the Overview tab, for the CPU click the column header for "Average CPU" so that the processes using the most CPU are shown top-down from most usage to least.
In Overview, for Disk click the Write (B/sec) column header, for Network click Send (B/sec), and for Memory click Commit (KB).
Then under the individual CPU, Memory, Disk, and Network tabs click on the similar column headers. Under any tab now you should be able to see the most prominent resource usages.
Notice how your CPU settles down after a while of idling.
Then click on the Disk tab to focus your attention on that one exclusively.
Let it sit for 5 or 10 minutes then check your CPU usage. See if it's been climbing gradually higher while you weren't looking.
kunley2 days ago
tl;dr: guy vibecodes a thing to measure something he doesn't fully understand and then realizes his methodology is wrong. Ends up with a catchy "X is a lie" title, which itself can be considered a lie.
timzaman2 days ago
What's become of hacker news that this is #2 post ? This is basic knowledge any programmer gets in their first few years..
therealdrag0a day ago
It’s a big industry with a wide range of knowledge levels.
saagarjhaa day ago
I encounter very few programmers who learn this.